


1. Introduction to Business Statistics.
Definition and Scope
Business Statistics refers to the application of statistical methods and techniques to real-world business problems. It involves collecting, organizing, analyzing, interpreting, and presenting data to support business decisions. From evaluating customer behavior to improving supply chain efficiency, business statistics provides the quantitative foundation upon which modern enterprises operate.
Statistics in business is not just about crunching numbers—it’s about extracting meaningful patterns from data that help business leaders understand their environment, forecast trends, and make informed strategic decisions. It forms the backbone of market research, quality control, financial analysis, risk management, operations optimization, and more.
There are two primary branches of business statistics:
- Descriptive Statistics:
This involves summarizing and presenting data in a meaningful way using tools like:- Mean, Median, Mode: Measures of central tendency.
- Standard Deviation and Variance: Measures of data spread.
- Charts and Graphs: Bar charts, histograms, pie charts, and line graphs.
For instance, a retail company might use descriptive statistics to analyze average monthly sales across regions.
- Inferential Statistics:
This branch allows businesses to make predictions and draw conclusions about a population based on a sample of data. Key tools include:- Hypothesis Testing: Determining whether observed trends are statistically significant.
- Regression Analysis: Identifying relationships between variables, such as marketing spend vs. sales.
- Confidence Intervals and Probability Distributions: Estimating ranges for future outcomes.
For example, a logistics company may use regression analysis to forecast delivery times based on distance and time of day.
Importance in Modern Business
In today’s fast-paced digital economy, data is being generated at an unprecedented rate. From user clicks on websites to product sales in physical stores, businesses have access to enormous datasets. However, raw data alone holds little value unless it is processed and analyzed—this is where business statistics becomes essential.
Decision-Making and Problem Solving
Business leaders face daily decisions involving resource allocation, pricing, marketing strategy, risk assessment, and operational efficiency. Using statistics, companies can replace guesswork with data-driven insights. For instance, a bank might use inferential statistics to assess loan default probabilities, helping it design more effective lending policies.
Forecasting and Strategic Planning
Through statistical modeling and forecasting, businesses can predict market trends, customer demand, inventory needs, and revenue streams. A telecom company, for instance, might forecast customer churn using logistic regression and plan targeted retention campaigns.
Operational Efficiency and Optimization
From improving manufacturing quality to reducing supply chain bottlenecks, statistical process control and analysis techniques help companies identify inefficiencies and reduce waste.
Supporting Evidence-Based Strategy
In the age of AI and machine learning, statistics underpins algorithms that power recommendation engines, customer segmentation, fraud detection, and personalized marketing—making it a fundamental part of digital transformation initiatives.
Visual Suggestion
Pie Chart Example:
“Percentage Use of Statistics in Different Business Functions”
- Marketing – 25%
- Finance – 20%
- HR – 15%
- Logistics – 20%
- Operations – 10%
- Strategic Planning – 10%
This pie chart can demonstrate how extensively business statistics is embedded in various organizational functions.
2. Core Concepts of Business Statistics

Understanding business statistics begins with grasping its foundational concepts—how data is gathered, interpreted, and used to make predictions. This section delves into the core pillars that support statistical analysis in real-world business applications.
Data Collection & Types
Data is the raw material of business statistics. Before analyzing anything, businesses must gather the right type of data from relevant sources.
Structured vs. Unstructured Data:
- Structured Data is highly organized and formatted to be easily searchable in databases and spreadsheets. Examples include sales transactions, customer demographics, or product inventory.
- Unstructured Data is complex and harder to process. This includes emails, social media posts, videos, or customer service chat logs. In today’s digital world, more than 80% of data is unstructured, making modern statistical tools and AI crucial for analysis.
Qualitative vs. Quantitative Data:
- Qualitative Data (categorical) is descriptive—used for variables like brand preference, gender, or product category.
- Quantitative Data is numerical—used for metrics such as revenue, number of units sold, or user login counts.
In business analytics, a mix of both is often used. For example, a retail company may analyze quantitative data (sales figures) and qualitative data (customer satisfaction ratings) to understand overall store performance.
Data Presentation
Once data is collected, it must be presented clearly to facilitate interpretation and communication.
Visual Techniques Include:
- Bar Charts & Pie Charts – For comparing categories.
- Histograms – For frequency distributions (e.g., number of products sold in different price ranges).
- Scatter Plots – To show relationships between two variables (e.g., advertising spend vs. sales revenue).
- Dashboards – Interactive visual interfaces that consolidate metrics from various departments (e.g., KPIs in marketing, HR, and finance).
Real-World Example:
A SaaS company may use a dashboard to display user acquisition trends, churn rates, and monthly recurring revenue—all powered by statistical summaries.
Probability & Distributions
Probability forms the theoretical foundation for inferential statistics. In business, it helps quantify uncertainty and assess risks.
Key Probability Distributions:
- Normal Distribution: A bell-shaped curve representing many natural phenomena, like employee test scores or product defects. Useful for standardization and benchmarking.
- Binomial Distribution: Models outcomes with two possibilities (success/failure), like whether a customer clicks an ad or not.
- Poisson Distribution: Used to model the number of times an event occurs within a fixed interval, such as calls to customer support or product returns per day.
Application in Business:
Customer arrival times at a service counter can often be modeled using a Poisson distribution, helping to schedule staffing efficiently.
Hypothesis Testing & Regression
These tools allow businesses to make data-driven decisions by validating or rejecting assumptions about their processes or markets.
Hypothesis Testing:
This involves setting up two opposing hypotheses (null and alternative) and using sample data to determine which is more likely.
- p-values help assess statistical significance. If p < 0.05, we reject the null hypothesis, suggesting the findings are not due to random chance.
Example:
A coffee chain may test whether a new layout increases customer satisfaction compared to the old layout.
Correlation vs. Causation:
- Correlation shows whether two variables move together (e.g., temperature and ice cream sales).
- Causation means one variable directly affects the other (e.g., a discount causes a sales spike).
Misinterpreting correlation as causation can lead to flawed decisions, making statistical controls essential.
Regression Analysis:
This explores the relationship between one dependent variable and one or more independent variables.
- Simple Linear Regression: Predicts outcomes based on a single input.
- Multiple Regression: Includes multiple inputs—like predicting sales based on price, advertising budget, and season.
Business Use Case:
An e-commerce company might use multiple regression to predict monthly revenue based on SEO budget, number of promotions, and competitor pricing.
Statistical Models in Forecasting
Forecasting is critical for proactive business planning—whether predicting inventory needs, sales, or economic trends.
Popular Forecasting Models:
- Time Series Analysis: Analyzes data points indexed in time order to detect patterns like trends and seasonality. Common in retail, finance, and logistics.
- ARIMA (AutoRegressive Integrated Moving Average): Advanced time-series forecasting model combining trend, autoregression, and moving average smoothing techniques.
- Exponential Smoothing: Gives more weight to recent data points—used in fast-changing industries like tech.
Example:
A fashion retailer forecasts demand using seasonal time series models to determine when to stock winter or summer collections.
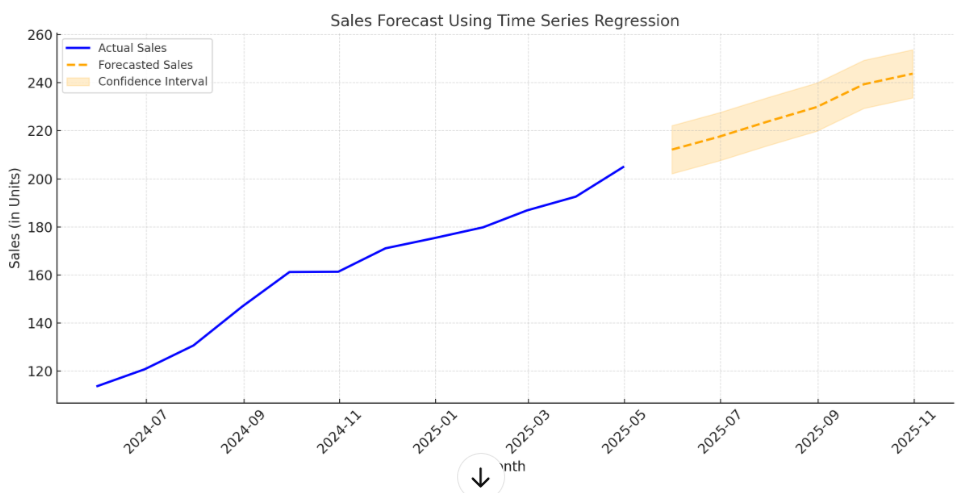
Graphical Suggestion:
Line Chart: Sales Forecast Using Time Series Regression
This graph could display:
- Actual sales from the past 12 months (solid line).
- Forecasted sales for the next 6 months (dotted line).
- Shaded area representing the confidence interval.
3. How Data Science Plays a Significant Role In Indian Railways.
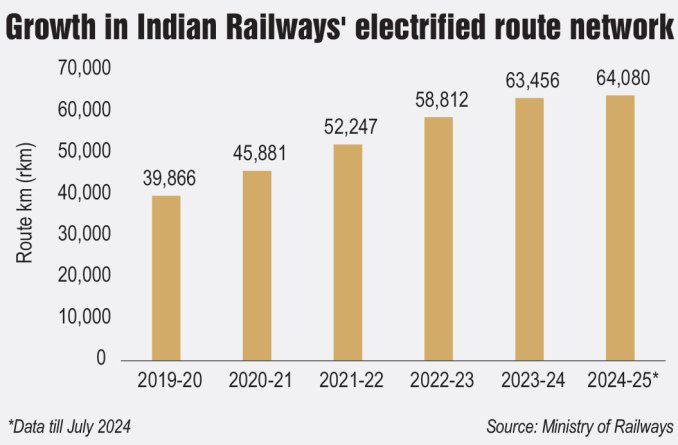
Indian Railways is one of the largest railway networks in the world, operating over 67,000 km of rail tracks and serving millions of passengers every day. With such a vast network, managing and optimizing railway operations can be daunting. By leveraging the power of data science, Indian Railways is transforming how it operates, manages its resources, and delivers services to its customers.
Data science is crucial in optimizing railway operations, improving safety, reducing downtime, and enhancing customer satisfaction. Through predictive maintenance, route optimization, demand forecasting, fraud detection, and real-time analytics, data science is enabling Indian Railways to make data-driven decisions that help the organization run more efficiently and provide better services to its customers.

Data Science
Data science is an interdisciplinary field that uses scientific methods, processes, algorithms, and systems to extract insights and knowledge from structured and unstructured data. It combines principles from statistics, mathematics, computer science, and domain-specific knowledge to understand and solve complex problems using data.
Data science involves several stages, including data collection, preparation, analysis, modeling, and visualization. It uses techniques such as statistical analysis, machine learning, data mining, and natural language processing to extract meaningful insights from data. The insights derived from data science are used to make informed decisions, predict future outcomes, and optimize processes in various fields, including business, healthcare, finance, and transportation.
Data science in Railways
Data science is a rapidly growing field that can potentially transform the railway industry. It involves using data, statistical and machine learning techniques, and domain expertise to extract insights and knowledge from data. In the railway industry, data science can improve safety, reliability, efficiency, and customer experience.
The railway industry generates vast amounts of data daily, including information on train schedules, track conditions, passenger demand, and equipment performance. Data science can help make sense of this data and turn it into actionable insights to improve operations.
Data science can also reduce fuel usage, shorten travel times, and improve train routes. Data scientists can determine the most effective and secure routes by examining data on train speeds, track conditions, and weather trends and also used to evaluate customer feedback data and pinpoint areas where the customer experience needs to be improved. Statistics scientists can pinpoint areas for improvement and improve the general customer experience by looking at statistics on train cleanliness, onboard amenities, and ticketing procedures.
Role Of Data Science in Indian Railways
● Predictive Maintenance: Indian Railways uses data science to predict maintenance requirements for its locomotives, coaches, and tracks. By analyzing sensor data, data scientists can identify patterns and predict when maintenance will be required, reducing downtime and improving safety. A detailed explanation of predictive analytics would be explained in the best data analytics courses available online.
● Route Optimization: Data science is helping Indian Railways optimize routes for the smooth movement of trains. Data scientists can suggest the most efficient routes by analyzing data on passenger and freight traffic, train schedules, and track capacity, reducing travel time and fuel consumption.
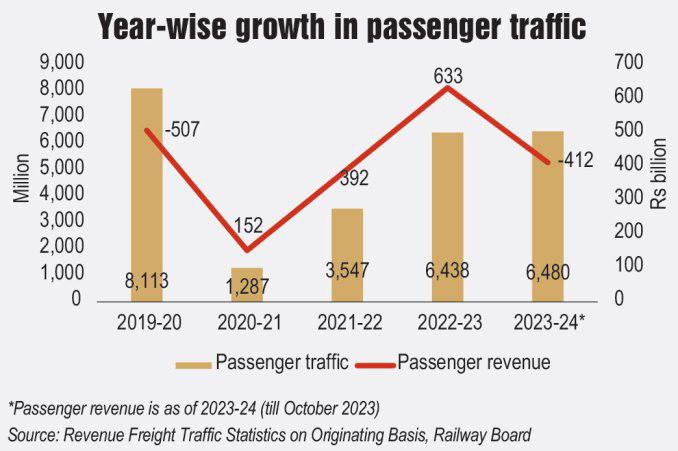
● Demand Forecasting: Data science is used to forecast passenger and freight service demand. By analysing historical data on passenger and freight traffic, weather patterns, and other relevant factors, data scientists can accurately predict demand for different routes and schedules. This helps Indian Railways allocate resources more efficiently and offer better services to customers.
● Fraud Detection: Data science is helping to detect fraudulent activities in the railway system. Data scientists can identify patterns that indicate fraud by analyzing data on ticket sales, passenger movements, and financial transactions and taking appropriate actions to prevent it.
● Real-time Analytics: Data science is used for real-time monitoring of train movements, track conditions, and passenger feedback. Data scientists can identify and address issues quickly by analyzing this data in real-time, improving safety and customer satisfaction.
● Improving Customer Experience: Data science is being used to analyze customer feedback and complaints, which helps Indian Railways identify improvement areas in its services. This helps the organization take corrective actions and provide better customer service.
● Capacity Planning: Data science is helping Indian Railways to plan for the future by predicting future demand and identifying areas where capacity needs to be increased. This helps the organization to allocate resources more efficiently and avoid congestion on the railway network.
● Safety Management: Data science is used to analyze safety-related data, such as accident data and near-miss incidents. Data scientists can suggest ways to improve safety and prevent accidents by identifying patterns in this data.
● Supply Chain Optimization: Data science is helping to optimize the supply chain by analyzing data on freight movements, including the type and volume of goods being transported. This helps Indian Railways improve its supply chain’s efficiency and reduce costs.
● Asset Management: Data science is used to manage assets, such as locomotives and coaches, efficiently. Data scientists can suggest ways to optimize asset utilization and reduce downtime by analyzing asset usage and maintenance data.
Conclusion
Data science is enabling Indian Railways to make data-driven decisions that help the organization run more efficiently, reduce costs, and provide better services to its customers. With the help of data science, Indian Railways can plan for the future, manage assets more effectively, and improve safety, thereby ensuring the longevity and sustainability of the railway network.
Overall, data science is a powerful tool transforming how Indian Railways operate and deliver services to its customers. By continuing to invest in data science, Indian Railways can stay ahead of the curve and maintain its position as one of the world’s largest and most efficient railway networks.
Tax Data Analytics: Tax Efficiency in the Digital Age: A Data Driven Approach
Introduction to Tax Data Analytics
In the realm of modern finance, the emergence of data analytics has revolutionized the way organizations approach taxation. By harnessing vast amounts of data and employing sophisticated analytical techniques, businesses can uncover valuable insights that lead to more strategic decision-making and enhanced tax efficiency. This transformative approach goes beyond traditional methods, tapping into the predictive power of data to anticipate future trends and outcomes.
- Predictive Analysis: By analyzing past tax data, firms can predict future tax liabilities with greater accuracy. For example, a company might use historical sales data to forecast upcoming VAT obligations, allowing for better cash flow management.
- Identification of Tax Savings: Data analytics enables the identification of potential tax savings by uncovering discrepancies and anomalies. A case in point is the detection of overpaid tax on employee benefits, which can be rectified and claimed back.
- Risk Management: Analytical tools can assess the risk levels associated with various tax positions, guiding firms in making informed decisions. An instance of this is evaluating the risk of claiming a contentious tax deduction.
- real-time reporting: The ability to process and report tax data in real-time enhances transparency and compliance. For instance, implementing systems that instantly reconcile sales data with tax invoices ensures accuracy in reporting.
- Global Tax Compliance: For multinational corporations, analytics can simplify the complexity of adhering to diverse tax regulations across different jurisdictions. This is exemplified by software that automatically adjusts transfer pricing calculations in line with local tax laws. Through these lenses, tax data analytics emerges as a cornerstone of strategic tax planning, offering a forward-looking perspective that aligns with the dynamic nature of the digital economy. The integration of these analytical capabilities into tax functions signifies a shift towards a more proactive and data-driven tax management paradigm.
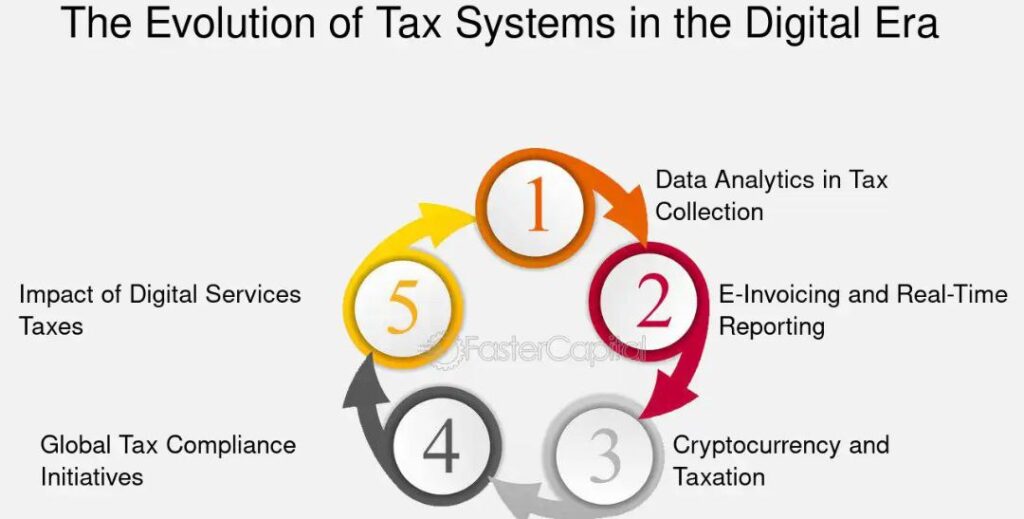
2. The Evolution of Tax Systems in the Digital Era
In the landscape of modern finance, the digitization of economies has catalyzed transformative changes in tax administration and compliance. The advent of digital technologies has not only streamlined processes but also introduced complex challenges and opportunities. Tax authorities worldwide are increasingly leveraging data analytics to enhance tax efficiency, ensuring that the digital footprints left by electronic transactions are accurately captured and analyzed.
- Data Analytics in Tax Collection: Advanced algorithms and machine learning techniques are now employed to sift through vast amounts of data, identifying patterns that may indicate tax evasion or fraud. For instance, the use of predictive analytics can flag anomalies in tax returns, prompting further investigation.
- E-Invoicing and Real-Time Reporting: Countries like Italy and Brazil have implemented mandatory e-invoicing systems, which require businesses to submit invoices electronically. This allows for real-time data collection and analysis, reducing the gap between reported and actual transactions.
- Cryptocurrency and Taxation: The rise of cryptocurrencies presents a unique challenge for tax systems. With transactions occurring on decentralized networks, tax authorities must adapt to track and tax these digital assets effectively. The internal Revenue service (IRS) in the United States, for example, has started to include questions about cryptocurrency transactions in tax forms to ensure compliance.
- Global Tax Compliance Initiatives: The Organization for Economic Co-operation and Development (OECD) has been at the forefront of designing frameworks for tax transparency and information sharing. The Common Reporting Standard (CRS) is one such initiative that facilitates the automatic exchange of financial account information between countries.
- Impact of Digital services Taxes: As digital giants like Google and Amazon dominate the global market, several countries have introduced digital services taxes (DSTs) to claim their share of revenue generated within their borders. This has led to complex tax implications and international negotiations to avoid double taxation. Through these examples, it is evident that the digital era has necessitated a rethinking of traditional tax systems. The integration of technology in tax administration is not just a trend but a pivotal shift towards a more efficient, transparent, and fair taxation process. As the digital economy continues to evolve, so too must the mechanisms in place to regulate and benefit from it. The journey towards a fully digital tax system is ongoing, with each step forward revealing new challenges and opportunities for innovation.
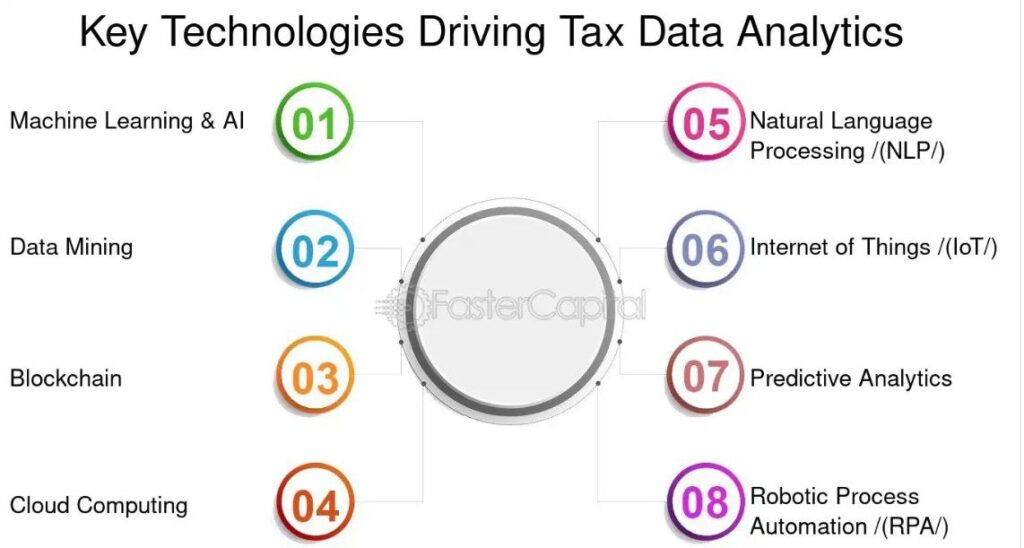
3. Key Technologies Driving Tax Data Analytics
In the realm of modern finance, the digitization of tax systems has been a transformative force, propelling the industry into a new era where data is not just an asset but the very backbone of decision-making processes. The convergence of various sophisticated technologies has enabled unprecedented levels of analysis, yielding insights that drive efficiency and strategic tax planning. Below, we explore the pivotal technologies that are reshaping the landscape of tax data analytics:
- Machine Learning & AI: These technologies are at the forefront, automating complex processes and uncovering patterns within vast datasets. For instance, machine learning algorithms can predict tax liabilities by analyzing past returns and current financial data, thereby optimizing tax strategies.
- Data Mining: This involves extracting valuable information from large pools of data. Tax professionals use data mining to identify anomalies or discrepancies that could indicate errors or opportunities for tax savings.
- Blockchain: Known for its robust security features, blockchain technology offers a tamper-proof ledger system. This is particularly beneficial for maintaining transparent and immutable records of transactions, which is crucial for accurate tax reporting.
- Cloud Computing: With cloud services, tax data analytics can be scaled up or down according to the need, providing flexibility and cost efficiency. Moreover, cloud platforms facilitate real-time data sharing and collaboration across global teams.
- Natural Language processing (NLP): NLP tools can interpret and categorize textual data from various sources such as emails, contracts, and invoices, which are essential for regulatory compliance and audit trails.
- Internet of Things (IoT): IoT devices collect real-time data from business operations, providing a continuous stream of information that can be analyzed for tax purposes, such as tracking asset usage and depreciation.
- Predictive Analytics: This technology uses historical data to forecast future trends, helping organizations anticipate changes in tax regulations and their potential impact.
- Robotic Process automation (RPA): RPA bots can handle repetitive tasks such as data entry, freeing up human resources for more strategic activities like tax planning and compliance strategy.
By integrating these technologies, organizations can not only ensure compliance with current tax laws but also gain strategic insights that can lead to more informed decision-making. For example, a multinational corporation might use predictive analytics to assess the impact of potential changes in international tax law on its operations, allowing it to proactively adjust its tax strategies accordingly. Similarly, RPA could
streamline the tax filing process by automatically populating returns with data extracted from financial systems, reducing the likelihood of errors and the time required to file.
This synergy of technology and tax analytics heralds a new chapter where tax departments are no longer seen as mere cost centers but as strategic contributors to the organization’s bottom line. The integration of these technologies not only streamlines the tax function but also provides a competitive edge in the digital economy.
4. Data-Driven Strategies for Tax Effieciency
In the realm of modern finance, the utilization of data analytics has become a cornerstone for optimizing tax strategies. By harnessing the power of big data, organizations can uncover hidden patterns, forecast future tax liabilities, and tailor their financial activities to maximize tax efficiency. This approach not only streamlines compliance but also strategically aligns tax planning with business objectives.
- Predictive Analysis: By leveraging historical data, companies can employ predictive models to estimate future tax obligations. For instance, a multinational corporation might analyze past sales data to forecast upcoming VAT or GST liabilities across different jurisdictions.
- Real-time Reporting: The advent of real-time data processing allows for immediate insights into financial transactions. A retail chain could implement a system that calculates sales tax on transactions as they occur, ensuring accurate, up-to-date tax reporting.
- Tax Optimization Algorithms: Sophisticated algorithms can assist in identifying the most tax-efficient ways to allocate income and expenses. A tech startup, for example, might use such algorithms to determine the optimal jurisdiction for intellectual property holdings, thereby reducing its overall tax burden.
- Regulatory Compliance: Data analytics tools can keep pace with the ever-changing tax regulations, helping companies remain compliant. An investment firm may use these tools to adapt to new capital gains tax laws, adjusting its investment strategies accordingly.
- Decision Support Systems: These systems provide actionable insights for strategic decision-making. A corporation considering a merger or acquisition could analyze the tax implications of various scenarios to decide on the most beneficial course of action.
Through these data-driven strategies, entities can not only ensure compliance with tax laws but also gain a competitive edge by making informed decisions that positively impact their financial health.
5. Challenges and Solutions in Modern Tax Analytics
In the realm of tax analytics, professionals are often confronted with a myriad of challenges that stem from the complex interplay of regulatory requirements, technological advancements, and the sheer volume of data. The intricacies of navigating this landscape require a multifaceted approach, blending compliance with innovation. As organizations strive to harness the power of data to drive tax efficiency, they encounter obstacles that range from data quality and integration issues to staying abreast of the ever-evolving tax legislation.
- Data quality and accessibility: The foundation of effective tax analytics lies in the quality of data. Inaccurate or incomplete data can lead to erroneous conclusions and potentially costly compliance issues. For instance, an organization may face difficulties in reconciling financial data from multiple systems, leading to discrepancies in tax reporting.
Solution: implementing robust data governance frameworks ensures the integrity and reliability of tax-related data. Regular audits and reconciliation processes, coupled with advanced data cleansing tools, can mitigate these risks.
2. Regulatory Compliance: Tax laws are notoriously dynamic, with frequent changes that can impact tax analytics. Organizations must adapt their analytics strategies to comply with new regulations, which can be a daunting task.
Solution: Leveraging regulatory technology (RegTech) solutions that incorporate artificial intelligence can help organizations stay current with changes in tax laws and regulations. These solutions can automatically update analytics models to reflect new tax rules.
- Technology Integration: The integration of new technologies into existing tax systems can be challenging. Organizations may struggle with legacy systems that are not equipped to handle modern data analytics tools.
Solution: A phased approach to technology adoption, starting with pilot programs to test new analytics tools, can ease the transition.
Additionally, investing in training for tax professionals on the latest analytics software can bridge the gap between old and new systems. - Analytical Talent: There is a growing need for tax professionals who are not only knowledgeable in tax laws but also skilled in data analytics. The talent gap can hinder the effective use of analytics in tax functions.
Solution: Developing in-house training programs to upskill existing staff and recruiting new talent with a background in data analytics can address this challenge. Collaborations with academic institutions to shape curricula that include tax analytics can also help cultivate future talent. - Security and Privacy: With the increasing reliance on data, concerns about data security and privacy are paramount. Tax data is sensitive, and any breach can have severe repercussions.
Solution: Investing in state-of-the-art cybersecurity measures and adhering to best practices in data privacy can protect against data breaches. regular security audits and employee training on data handling protocols can further reinforce security measures. By addressing these challenges with innovative solutions, organizations can enhance their tax analytics capabilities, leading to more strategic decision-making and improved tax efficiency. The journey towards a data-driven tax function is complex but achievable with the right mix of technology, talent, and processes.
I basically apply with my teams the lean startup principles I used in the private sector – go into Silicon Valley mode, work at startup speed, and attack, doing things in short amounts of time with extremely limited resources.
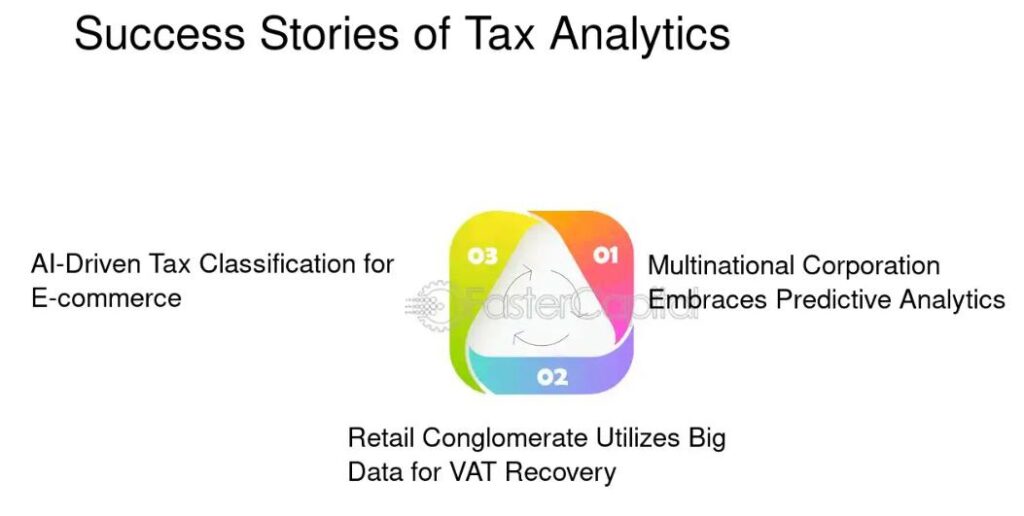
6. Sucess Stories of Tax Analytics
In the realm of modern finance, the implementation of data analytics in tax strategies has revolutionized the way organizations approach fiscal responsibilities. The transformative power of this technology is not merely theoretical; it is evidenced by a multitude of entities that have harnessed data-driven methodologies to optimize their tax functions, yielding substantial benefits. These entities serve as beacons, guiding the path for others in the labyrinth of tax efficiency.
- Multinational Corporation Embraces Predictive Analytics: A leading tech giant, previously grappling with the complexities of international tax compliance, integrated predictive analytics into their tax strategy. This shift enabled the prediction of tax liabilities across various jurisdictions, resulting in a 20% reduction in compliance costs and a significant decrease in tax-related risks.
- Retail Conglomerate Utilizes Big Data for VAT Recovery: By deploying big data tools to analyze transactional data, a global retail chain identified discrepancies in VAT payments, reclaiming millions in overpaid taxes. This proactive approach not only improved their bottom line but also set a precedent for tax departments to become profit centers.
- AI-Driven Tax Classification for E-commerce: An e-commerce platform implemented an AI algorithm to classify products for tax purposes accurately. This innovation led to a 30% improvement in tax classification accuracy and a marked reduction in manual labor,
showcasing the potential of machine learning in tax analytics.
These narratives underscore the efficacy of tax analytics in achieving tax efficiency. By embracing a data-driven approach, organizations can navigate the complexities of tax laws with greater confidence and precision, turning the once-daunting task of tax management into a strategic advantage. The success stories above are a testament to the transformative potential of tax analytics in the digital age.
6. Success Stories of Tax Analytics
In the realm of modern finance, the implementation of data analytics in tax strategies has revolutionized the way organizations approach fiscal responsibilities. The transformative power of this technology is not merely theoretical; it is evidenced by a multitude of entities that have harnessed data-driven methodologies to optimize their tax functions, yielding substantial benefits. These entities serve as beacons, guiding the path for others in the labyrinth of tax efficiency.
- Multinational Corporation Embraces Predictive Analytics: A leading tech giant, previously grappling with the complexities of international tax compliance, integrated predictive analytics into their tax strategy. This shift enabled the prediction of tax liabilities across various jurisdictions, resulting in a 20% reduction in compliance costs and a significant decrease in tax-related risks.
- Retail Conglomerate Utilizes Big Data for VAT Recovery: By deploying big data tools to analyze
transactional data, a global retail chain identified discrepancies in VAT payments, reclaiming millions in overpaid taxes. This proactive approach not only improved their bottom line but also set a precedent for tax departments to become profit centers. - AI-Driven Tax Classification for E-commerce: An e-commerce platform implemented an AI algorithm to classify products for tax purposes accurately. This innovation led to a 30% improvement in tax classification accuracy and a marked reduction in manual labor, showcasing the potential of machine learning in tax analytics.
These narratives underscore the efficacy of tax analytics in achieving tax efficiency. By embracing a data-driven approach, organizations can navigate the complexities of tax laws with greater confidence and precision, turning the once-daunting task of tax management into a strategic advantage. The success stories above are a testament to the transformative potential of tax analytics in the digital age.
Data Analytics in FMCG: Its Meaning, Important & Use Cases

Data analytics help the FMCG industry to reduce costs, streamline production and supply chain, and take the products to the right target market at the right time. It provides companies with the necessary insights to adopt the data-driven model for decision-making. Let’s understand the effective role of data analytics in the FMCG sector.
Data analytics is the practice of analyzing datasets to derive meaningful insights. It answers questions, gives patterns, and helps in making decisions based on proper evidence/ context. During the last few years, many establishments from various industries have adopted new technology to process data and derive insights. The FMCG (Fast Moving Consumer Goods) industry too followed suit to streamline
its manufacturing, supplying, and customer care services.
The FMCG industry is also known as Consumer Packed Goods (CPG) industry and happens to be the largest market internationally. The MENA (Middle East and North Africa) region saw high demand for consumer goods before the Covid-19 pandemic pushed things into turmoil.
Statistics show that Saudi Arabia has a total retail consumer spending of $271919.41 million. Though there has been a 64% decrease in customers who went to supermarkets, the demand for goods hasn’t gone down. The market shifted from brick-and-mortar stores to online retailing. Moreover, the consumer trends in GCC (Gulf Corporation Council) have begun to resemble the trends in the US. There has been a polarization of consumers based on price, branding, quality, and convenience. In fact, the changes started after 2015, when major developments took place in the GCC, be it the introduction of VAT or an increase in working hours.
A research report shows that 69% of UAE and 63% of Saudi Arabia consumers prefer to pay more if a brand guarantees quality products. Furthermore, modern trade is continuing to become famous in the region. In such instances, an FMCG manufacturer/seller needs to understand the market/ consumer requirements to become successful and gain a competitive edge over other players. This is possible when the establishment makes use of big data analytics to gather accurate and meaningful insights for decision-making.
The Significance of Big Data Analytics in FMCG
Data analytics in FMCG companies helps improve the scalability, flexibility, and value creation of the business. It is a dynamic industry that requires an equally dynamic approach to stay ahead of the trends and provide consumers with valuable services. For example, the omnichannel shopping experience can be best delivered when the enterprise leverages big data analytics.
Running data analytics requires making changes to the existing business systems. Outdated technologies and legacy systems cannot work efficiently with advanced analytical tools. Businesses should first work on digital transformation and invest in data management solutions to build a streamlined data flow within the establishment.
Knowing which tools and technology to use is vital to successfully implementing the data-driven model in the business. That’s where offshore solution providers step into the picture and offer end-to-end services to set up, integrate, implement, and manage big data analytical tools.
The main purpose of using data analytics in the FMCG industry is to increase sales and profits by providing consumers with what they want. This requires flexibility, adaptability, and agility to align and realign the goals with the market demands. Understanding customers and working on real-time customer engagement will lead to an increase in customer loyalty.
Why Data Analytics Is Important in FMCG
Be it inventory, supply chain, or consumer experience, data analytics can help the FMCG industry use predictive intelligence in real-time to make the right decisions. Here, we’ll focus solely on how big data analytics companies assist businesses in dealing with consumer preferences and understanding the target market.
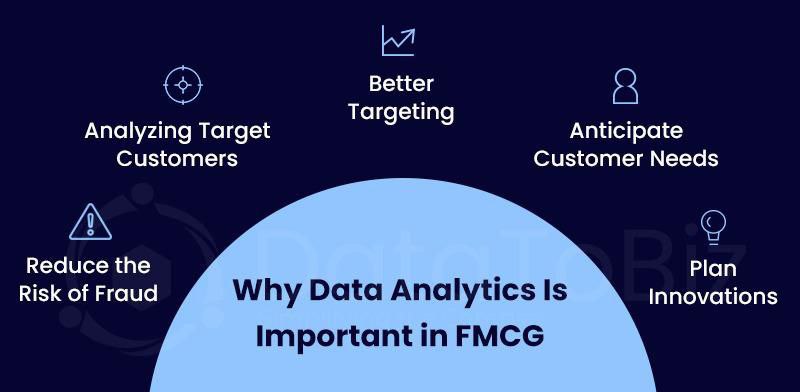
Analyzing Target Customers
There’s no denying the pressure of a competitive market. It’s hard to have loyal customers in the FMCG industry with new brands, products, and companies entering the market every day. Data analytics help you to understand your target audience.
Who are your target customers? What do you know about them? What are the demographics? Such questions can be answered using data analytics. It helps identify potential customers for a long-term relationship with the business.
Better Targeting
Marketing and promotions play a significant role in today’s world. Businesses need to grab customers’ attention with marketing and wow them with their products. For that, the business should know which type of marketing and advertising strategies will deliver results.
For example, having a business website and optimizing it for search engines has become compulsory to reach internet users. TV ads work for brands whose target customers spend more time watching the telly. Data analytics will give the necessary insights to plan marketing campaigns.
Reduce the Risk of Fraud
If attracting customers is one aspect, identifying fraudsters is another crucial issue. How does a business know that the person is a genuine customer and not a fraudster? The advent of online retailing and eCommerce has increased the rate of fraudulent transactions. Many businesses face losses due to a lack of awareness and control over such incidents.
Data analytics can help define the weak spots and analyze a customer to determine the chances of a fraudulent transaction. Such transactions can be blocked, rejected, or prevented to avoid losses.
Anticipate Customer Needs
One way to inspire consumer loyalty is by anticipating their needs and delivering the products/ services. If a customer wants to go digital and make online purchases, an eCommerce website will help keep the customer instead of losing them to a competitor who offers this service.
Data analytics in FMGC uses data from multiple sources and processes this data in
real-time to anticipate what customer wants through predictive analytics.
Plan Innovations
What kind of products will the customers buy? What changes does a brand need to make to the existing products to drive sales? How can you redesign the store to make customers spend more time because of the attractive atmosphere and not because they can’t find what they want?
Data analytics will help the business read the market trends accurately and be ready to grab opportunities before the competitors. Moreover, innovations in product research and development can be patented, which adds to the brand image.
Data Analytics Use Cases in the FMCG industry
Let’s look at some of the use cases of data analytics in the FMCG sector to understand how it can help with every aspect of the business to change the focus from product centric to customer-centric.
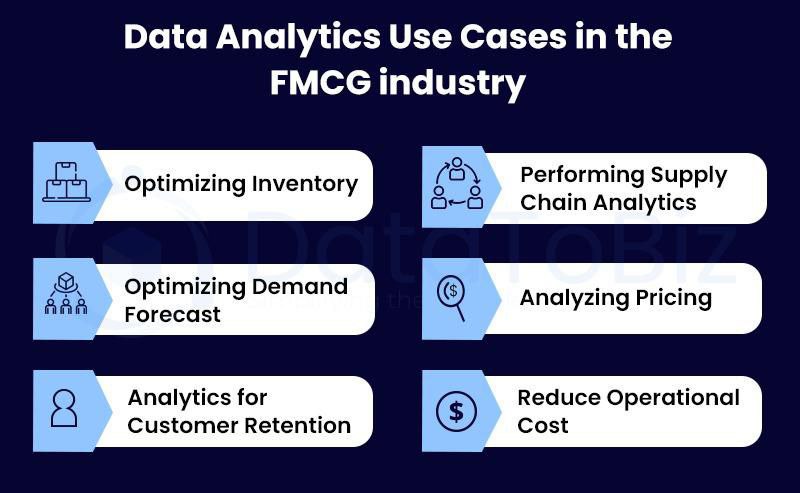
Optimizing Inventory
The increase in customer expectations put FMCG companies in a tricky spot. How much stock should they release into the market? How much should they store in the warehouse? What should be the ratio of work in progress to finished goods?
Data analytics will answer the questions based on historical and real-time data. Businesses can now manage their inventory to suit the market demands.
Performing Supply Chain Analytics:
The supply chain is the most crucial part of the FMCG industry. A delay at one level could disrupt the entire supply chain and push the company into chaos. We’ve experienced this during the Covid-19 pandemic. Data analytics can minimize the risk of supply chain disruptions by predicting issues in advance and empowering the business to be proactive instead of reactive.
Optimizing Demand Forecast
The sales teams run various analytics to forecast market demands. This gives the business the required information to continuously make changes and improvements to its approach. Accurate demand forecasting will put the business in a prominent position by reducing expenses and increasing returns.
Analyzing Pricing
Knowing how much to price a product is one of the toughest parts of working in the FMCG industry. Aspects like target buyers, quality of the product, competitor’s pricing, market demand, etc., should be considered. Discounting the price for promotions requires a similar approach. Data analytics uses the input details to generate reports that help the sales and marketing teams make the right decisions.
Analytics for Customer Retention
Hypercompetitive markets are the trademark of the FMCG industry. Customer retention can make or break a business. Data analytics will help the companies identify ways to inspire customer loyalty in different segments. Businesses can personalize their strategies for each customer segment and get the desired results.
Reduce Operational Cost
Is a business spending too much money to manufacture a product? Are there ways to reduce the costs without compromising quality? Can the business try new suppliers for raw materials? Will hiring third-party logistics service providers to reduce the expenses?
Data analytics can answer such questions and more. The FMCG industry can unlock the mantra to balance expenses and returns.
Conclusion
Various factors such as seasonal changes, socioeconomic conditions, politics, ideologies, raw materials, pricing, etc., impact the FMCG market in many ways. Tracking every aspect of the business requires the right technology.
Data consultancy services offer by big data companies help businesses rebuild their systems to suit the volatile market requirements and become an industry leader. Data analytics will identify the gaps in the business strategies and prepare companies to be proactive when dealing with the market trends.
Predictive Modeling in Marketing
Customer data has always been essential to high-leverage decision-making. The more we know, the better decisions we can make. But while the data of the past was easy to keep in one’s head, today we generate and track millions of data points that require powerful analytical tools to process.
In the digitization era, companies are used to engaging with and buying products online. Even significant enterprise software contracts might start with a quick message in an online chat. That’s why online marketing campaigns and advertising are becoming more sophisticated and consequential to business growth.
Data is king.
If you have more accurate data than your competitors, you’ll always be a few steps ahead, targeting the market with more precision while spending less.
This creates a cycle of ever-improving data analysis and allows you to leverage predictive modeling marketing, which can improve your conversion rates and bring in more revenue.
Tip: Get the best of predictive capabilities in one automated tool with Lift AI. It integrates right into your marketing stack and identifies website visitors with the highest buyer intent, simplifying your sales process.
What Is Predictive Modeling and How Can it Benefit Marketing Teams?
Predictive modelling in marketing allows companies to find the most effective marketing strategy and make better marketing decisions by leveraging data with the help of AI or machine learning.
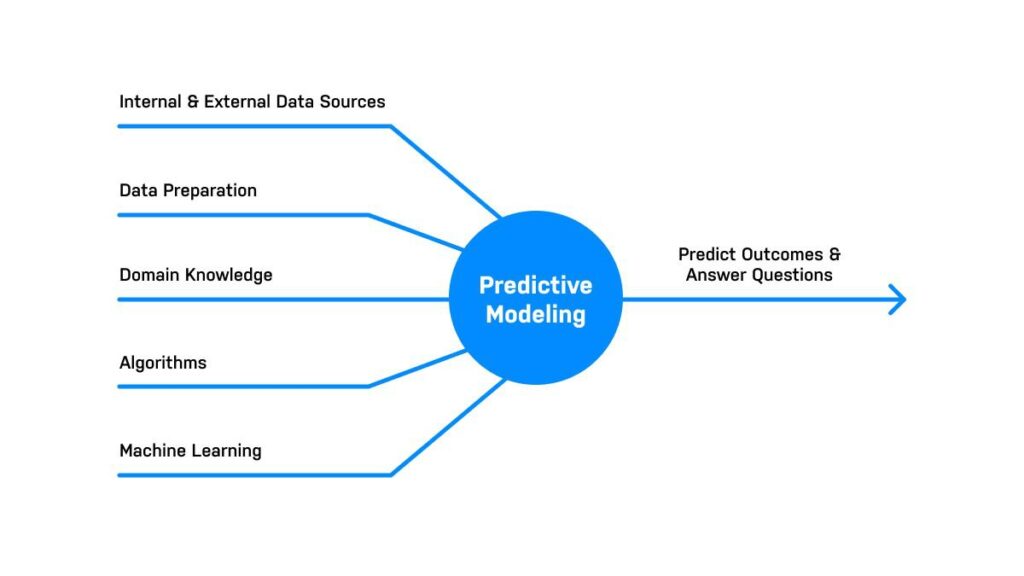
Predictive modeling is a statistical technique that analyzes historical data to predict future outcomes, building a mathematical model to identify relationships and trends in the data and predict outcomes based on these insights.
There are two types of predictive modeling marketing:
● Autonomous (e.g. showing tailored product recommendations based on past behavior)
● Informative (e.g. suggesting a better headline for a newsletter)
Both types evaluate millions of data points, from time to location to demographics to past actions, to produce accurate results.
A few years ago, AI capabilities on this scale were only available to leading tech giants with in-house data scientists.
Today, predictive analytics and modeling can be used by any company that sees the benefit of leveraging the latest technology to reach its goals.
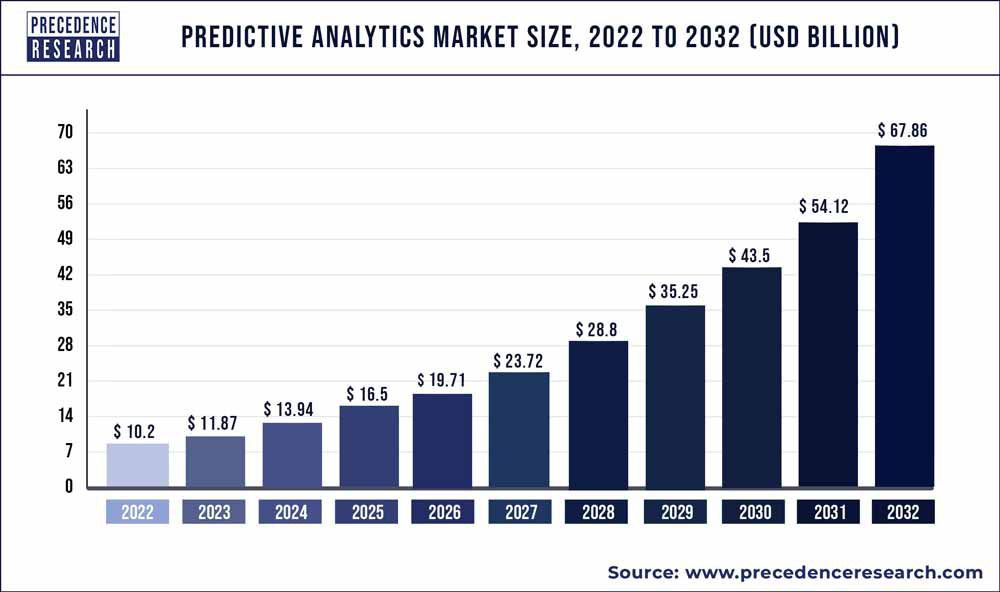
And we’ve still only begun to scratch the surface of potential uses for predictive analytics and modeling. A recent Precedence Research report projects that the predictive analytics market will reach $67.86 billion by 2032.
Types of Predictive Models Used in Marketing
There are several common types of predictive models marketers use to forecast customer behavior and optimize campaigns:
Clustering models
This predictive model is used to segment customers into groups based on shared characteristics or behaviours. You can customize your marketing messages and campaigns by strategically identifying customer segments to maximize their impact and drive results.
HubSpot identifies seven different types of segmentation models that companies can use to easily personalize customer experiences.

Propensity models
Also called predictive scoring, propensity models forecast the probability of a customer engaging in a specific action, like purchasing a product, canceling a service (churning), or responding to a marketing campaign. These models analyze past customer behavior and pinpoint patterns marketers can use to predict future behavior.
Lift AI, for example, uses machine learning and behavioral data to assign a buyer intent score to every website visitor, whether they’re known or anonymous. This predictive modeling technique allows companies to create custom engagement strategies that more closely align with visitors’ intent.
Here, we see how a company may use chat technology to provide a targeted customer experience while
also increasing the efficiency of its sales team’s efforts. Propensity models can also be used to improve customer retention and reduce customer churn. This predictive model is especially valuable for subscription services that want to pinpoint customers who are at risk of canceling their subscriptions so they can provide them with a compelling discount or other incentive to ensure they remain loyal.
Collaborative filtering models
Collaborative filtering models are a powerful tool for recommending products and services based on customer behaviour and similar customer preferences.
There are two types of collaborative filtering:
● User-based measures similarities between users. For instance, a streaming service could use collaborative filtering to offer personalized movie recommendations by analyzing a customer’s previous movie choices and those of similar users with comparable tastes.
● Item-based measures similarities between items that users rate or buy, and other items. Amazon uses this extensively to upsell additional items that can accompany what a user is browsing to purchase.
In addition to Amazon, this predictive model powers the recommendation engines used by companies like Netflix, LinkedIn and Spotify.
Regression models
Regression models are statistical techniques that uncover the relationship between one or more independent variables (factors you can influence) and a dependent variable (the outcome you want to predict). This translates to understanding how different factors impact key metrics.
Marketing and sales teams can use regression models to:
● Optimize marketing campaigns
● Perform price sensitivity analysis
● Predict customer lifetime value (CLV)
● Optimize sales territories
● Forecast sales
● Measure marketing ROI
● Find opportunities to upsell and cross-sell
Time series models
This predictive model forecasts future events based on trends in historical data. It’s especially helpful for predicting factors like seasonal sales fluctuations, inventory management, website traffic patterns, or product demand.
As this graphic from Intelliarts shows, time series modeling is an effective tool across many industries and use cases outside of sales and marketing.
4. Role of Business Statistics in AI & IT Technologies.

Introduction
- Business statistics form the core mathematical framework behind Artificial Intelligence (AI) and IT technologies.
- AI models rely heavily on statistical theories and methods to analyze data, learn from it, and make predictions.
- The synergy between statistics and AI enables smart decision-making in industries ranging from healthcare to finance.
AI & Machine Learning: Statistical Foundations
- Statistical Models as AI Backbone: Machine learning algorithms, whether supervised or unsupervised, use statistical principles to infer patterns from data.
- Examples:
- Regression models: Linear and logistic regression models are classical statistical methods applied in supervised learning for prediction and classification.
- Bayesian methods: Used extensively in Natural Language Processing (NLP) and probabilistic modeling, Bayesian inference updates the probability of hypotheses as more data becomes available.
- Clustering algorithms: K-means and hierarchical clustering apply statistical distance metrics to group similar data points.
Data Preprocessing Using Statistical Techniques
- Before feeding data into AI models, statistical techniques ensure quality and consistency:
- Feature selection: Using correlation coefficients and hypothesis tests to select relevant variables.
- Standardization and normalization: Transforming data to have zero mean and unit variance to improve model performance.
- Outlier detection and removal: Using statistical tests (e.g., Z-score, IQR) to identify and handle anomalies that can distort model learning.
Model Evaluation Metrics Rooted in Statistics
- After training models, evaluation is crucial and largely statistical:
- Confusion Matrix: Summarizes the performance of classification models, showing true positives, false positives, etc.
- Precision, Recall, F1 Score: Metrics that balance the trade-offs between false positives and false negatives.
- ROC Curve and AUC: Statistical tools to assess model’s ability to distinguish between classes.
- These metrics rely on statistical concepts of probability and error rates.
Case Studies Demonstrating AI + Statistics in Real Life
- Predictive Maintenance in Manufacturing: Using regression models and time series statistics to predict machine failures before they happen, reducing downtime.
- Medical Diagnostics: AI models trained on patient data use survival analysis and logistic regression to predict disease risks and outcomes.
- Sentiment Analysis on Social Media: Combining NLP Bayesian models with statistical sentiment scoring to analyze public opinion trends (e.g., Twitter data).
Graphical Suggestion
- AI Model Accuracy Comparison Chart:
- A bar chart comparing different AI models (e.g., Logistic Regression, Random Forest, Neural Networks) using statistical evaluation metrics such as Accuracy, F1 Score, and AUC.
5. Challenges and Ethical Considerations in Business Statistics.

As business statistics becomes an increasingly integral part of strategic decision-making, it’s vital to acknowledge and address the challenges and ethical implications associated with its use. Misuse or misinterpretation of statistical data can not only lead to poor decisions but also result in unintended societal consequences. This section outlines the key concerns: data quality, statistical misinterpretation, and ethical issues in data usage.
1. Data Quality Issues
One of the primary challenges in business statistics is maintaining high-quality, reliable data. Business decisions driven by incomplete, outdated, or biased datasets can be misleading and harmful. For example:
- Incomplete Data: If key demographic information is missing in a customer survey, the analysis may be skewed toward a certain segment.
- Biased Sampling: Sampling only urban populations for a nationwide marketing strategy ignores rural markets, resulting in unrepresentative findings.
- Non-Random Sampling: This can introduce systemic bias, making statistical inference invalid. For instance, using data from only top-performing retail stores while ignoring underperforming ones presents a falsely optimistic business outlook.
Ensuring data accuracy, completeness, and neutrality is essential for meaningful analysis and actionable insights.
2. Misinterpretation of Statistics
Even high-quality data can be rendered useless—or dangerous—if statistical results are misunderstood. Two of the most common pitfalls include:
- Correlation ≠ Causation: Just because two variables move together doesn’t mean one causes the other. For example, a business might observe a correlation between high web traffic and sales but ignore other factors like marketing campaigns or seasonal demand.
- Improper Use of Averages: Relying on the mean in a dataset with outliers can distort reality. Median or mode may be more appropriate depending on data distribution.
- Overfitting Models: In predictive analytics, models trained too closely on historical data may fail to generalize to future data, leading to overconfidence in forecasts.
Educating decision-makers on statistical literacy is critical to avoid such misinterpretations.
3. Ethics in Data Use
With the rise of AI, big data, and surveillance technologies, ethical use of statistical data is under increasing scrutiny. Businesses must uphold ethical standards in the way they collect, process, and analyze data.
Key ethical principles include:
- Transparency: Organizations must clearly communicate how data is collected and used, especially when involving automated decisions.
- Informed Consent: Especially relevant in customer data analytics and HR, consent must be explicitly obtained before collecting personal data.
- Fairness: Statistical models used in lending, hiring, or insurance must be tested for bias against gender, ethnicity, or socioeconomic status.
For example, AI hiring tools trained on historical hiring data may perpetuate past biases unless corrected with fair statistical techniques.
6. Future Outlook and Emerging Trends in Business Statistics.

As the world continues to generate massive volumes of data, business statistics is evolving beyond traditional analysis into a futuristic ecosystem of automation, real-time intelligence, and deep integration with cutting-edge technologies. The next frontier of business decision-making will depend on how effectively organizations embrace this transformation.
1. Integration with AI, IoT, and Quantum Computing
Business statistics has always been foundational to artificial intelligence. What’s changing now is the level of integration and scalability made possible by exponential advances in computational power and sensor technologies:
- Artificial Intelligence (AI): Statistical techniques like regression, classification, and hypothesis testing form the basis for AI algorithms. As AI matures, businesses are embedding statistical models directly into products—like chatbots, recommendation engines, and fraud detection systems.
- Internet of Things (IoT): IoT devices generate real-time data streams from logistics chains, smart cities, health monitors, and industrial machinery. Statistical models process these datasets to derive insights instantly, enabling predictive maintenance, supply chain optimization, and environmental tracking.
- Quantum Computing: Although still in its early stages, quantum computing promises to solve complex optimization and simulation problems that are currently intractable. This could redefine statistical computing, particularly in finance, logistics, and pharmaceuticals, by running multivariate models at previously unimaginable scales and speeds.
2. Real-Time Analytics and Edge Computing
One of the major trends transforming statistical practice is real-time data analysis:
- Edge Computing allows statistical algorithms to run closer to the data source, such as in a self-driving car or a smart manufacturing sensor. This minimizes latency and enables instant decision-making.
- For instance, a retail chain can monitor customer footfall and adjust staffing or inventory levels in real time using time-series models at the edge.
As industries move from retrospective analysis to real-time decision intelligence, the statistical models must evolve to be faster, leaner, and continuously adaptive.
3. AutoML and No-Code Statistics Platforms
With the growing demand for data-driven decisions across all departments—not just IT or data science—tools that democratize statistical modeling are on the rise:
- AutoML (Automated Machine Learning): Platforms like Google AutoML and H2O.ai allow business users to input data and generate predictive models without coding. They automate everything from data preprocessing and feature selection to model selection and tuning.
- No-Code Tools: Software such as Tableau, Power BI, and Microsoft Excel’s Data Analysis Toolpak lets non-experts build dashboards and perform basic statistical testing without a statistical background.
This ease of use is expanding access to analytics across marketing, HR, operations, and even small businesses, accelerating data literacy organization-wide.
4. Increased Use in Sustainable and Impact-Driven Businesses
The future of business statistics isn’t just faster or more automated—it’s also more ethical and impact-focused:
- Sustainability Analytics: Companies are using statistics to track carbon emissions, water usage, and waste generation. Predictive models forecast environmental impact across supply chains.
- Social Impact Measurement: Nonprofits and ESG-focused businesses use statistical indicators to quantify social value, from education outcomes to community health.
- Integrated Reporting: Tools like SASB (Sustainability Accounting Standards Board) and GRI (Global Reporting Initiative) combine traditional business KPIs with environmental and social statistics to report holistic business performance.
7. Conclusion

In an age where data is the new currency, business statistics serves as the strategic compass guiding organizations through the complexities of modern enterprise environments. From customer insights to economic forecasting, fraud detection to HR analytics, statistical methods allow companies to make sense of vast and often chaotic information, transforming it into actionable intelligence.
This blog has shown how statistics is woven into the very fabric of business operations—whether it’s optimizing marketing campaigns using regression models, predicting maintenance schedules through time series forecasting in Indian Railways, or supporting national policy decisions through economic modeling at NITI Aayog. We also explored how major industries such as finance, healthcare, insurance, and even social media rely heavily on data interpretation and predictive modeling, demonstrating the profound impact of statistics on performance and innovation.
The evolution of artificial intelligence, machine learning, big data, and IoT has only deepened the reliance on statistical foundations. Whether it’s preprocessing data, training models, or interpreting outcomes with metrics like ROC curves and F1 scores, statistics forms the backbone of intelligent technologies. And with the emergence of AutoML, no-code analytics, and real-time dashboards, statistical thinking is now more accessible than ever before—even for non-technical users.
Yet, alongside its power, statistics demands ethical responsibility. Misinterpretation, biased datasets, and opaque models can lead to flawed decisions or social inequities. Businesses must prioritize data quality, transparency, and fairness to ensure that analytics serve both profitability and the public good.
In essence, business statistics is not just about crunching numbers—it’s about asking the right questions, uncovering hidden patterns, validating assumptions, and informing strategic choices. As technology advances and markets evolve, the relevance of statistics will continue to grow, becoming even more integral to resilient, sustainable, and forward-looking enterprises.
To succeed in the data-driven future, every business function—from marketing to operations, HR to finance—must embrace statistical thinking as a core competency. It’s no longer a luxury for data scientists—it’s a necessity for every decision-maker.
📘 Appendix
📚 Glossary of Statistical Terms
| Term | Definition |
|---|---|
| Mean | The average of a data set. Sum of values divided by the number of observations. |
| Median | The middle value in a sorted data set. |
| Mode | The value that appears most frequently in a data set. |
| Standard Deviation (σ) | A measure of the dispersion or spread of data points from the mean. |
| Variance | The square of the standard deviation; shows how much the data is spread out. |
| Regression | A statistical technique used to determine relationships between variables. |
| Correlation | A measure of how closely two variables move in relation to each other. |
| Hypothesis Testing | A method to determine if there is enough evidence to reject a null hypothesis. |
| P-value | The probability of observing the data assuming the null hypothesis is true. |
| Confidence Interval | A range of values within which a population parameter is expected to lie. |
| Normal Distribution | A bell-shaped distribution that is symmetric around the mean. |
| Binomial Distribution | A distribution used to describe the number of successes in a fixed number of trials. |
| Poisson Distribution | Describes the probability of a given number of events occurring in a fixed interval. |
| Time Series | Data collected or recorded at specific time intervals. |
| Outlier | A data point that is significantly different from others in the set. |
🛠️ List of Recommended Tools
Software and Platforms:
- SPSS (Statistical Package for the Social Sciences)
- Best for: User-friendly interface for statistical analysis, commonly used in academia and market research.
- Use Cases: Hypothesis testing, regression, factor analysis.
- R Programming Language
- Best for: Open-source statistical computing and graphics.
- Libraries:
ggplot2,dplyr,caret,forecast. - Use Cases: Data visualization, time series analysis, statistical modeling.
- Python (with Statistical Libraries)
- Best for: Flexible programming and integration with AI/ML workflows.
- Libraries:
- Pandas – Data manipulation and analysis
- NumPy – Numerical operations
- SciPy – Statistical computations
- Statsmodels – Regression and statistical tests
- Matplotlib / Seaborn – Data visualization
- Scikit-learn – Machine learning models based on statistical theory
- PyMC3 / PyStan – Bayesian statistical modeling
- Excel
- Best for: Quick calculations, descriptive statistics, small data analysis.
- Use Cases: Pivot tables, forecasting, regression.
- Tableau / Power BI
- Best for: Creating interactive dashboards and data visualizations.
- Use Cases: Business reporting, trend analysis, real-time analytics.
- JASP & Jamovi
- Best for: GUI-based open-source statistical analysis, similar to SPSS but free.
- Use Cases: Quick and accurate hypothesis testing and descriptive analysis.
These tools and terms form the backbone of business statistics. Whether you’re building a predictive model, evaluating market strategies, or simply trying to make informed decisions, a strong grasp of these resources will amplify your analytical capabilities.