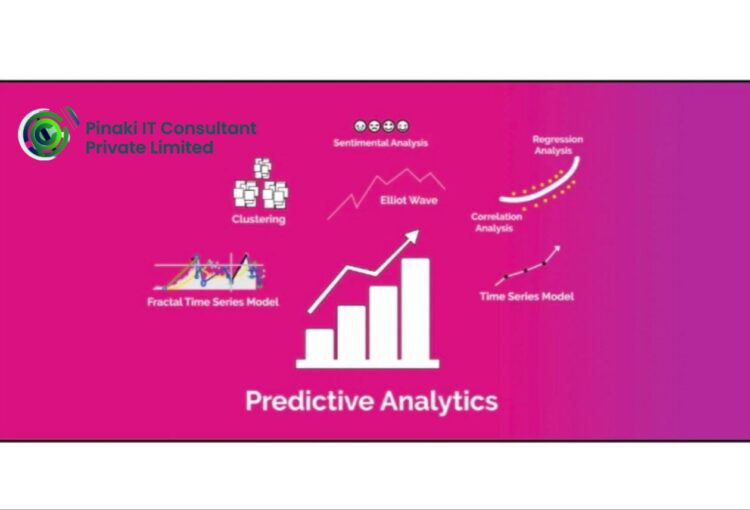
Master the Power of Data with R for Real-World Business Insights

Business Statistics by Using R Programming

No prior programming experience is needed — we start from the very basics of R and build up gradually.

Unlock the Power of Data-Driven Business Decision-Making

Business Statistics by Using R Programming

In the modern era of data explosion, businesses thrive not only on intuition but more importantly on evidence-based decisions. To keep pace with the ever-evolving landscape of analytics and big data, it’s essential to possess a robust understanding of business statistics — and there’s no better tool to aid in that journey than R programming.

“Business Statistics by Using R Programming” is a comprehensive learning path designed to help you bridge the gap between statistical theory and real-world business applications. This course equips you with both conceptual knowledge of statistics and hands-on experience with R, enabling you to make data-driven decisions, perform high-quality analyses, and extract actionable insights that can drive business growth.

Whether you’re an aspiring data analyst, a business professional looking to upskill, or a student preparing for a career in analytics, this course offers you everything you need to become proficient in both quantitative reasoning and data manipulation with R.

Why This Course Matters

Statistics is the language of data, and in the business world, it’s the tool that translates raw numbers into meaningful decisions. R, on the other hand, is a versatile and powerful programming language used by statisticians, data scientists, and analysts across the globe.

Here's why mastering both is a game-changer:

  • 📊 Data is the new oil — But without statistics, it’s just noise. With this course, you’ll learn how to mine useful insights from data using R.

  • 💻 R is open-source and widely adopted — Organizations from tech giants to financial institutions use R for analytics, forecasting, and decision-making.

  • 📈 Statistical literacy is a top skill — Business roles increasingly demand professionals who can understand trends, test hypotheses, and present findings clearly.

  • 🚀 Career advancement — Whether you’re in marketing, finance, operations, HR, or entrepreneurship, adding R and statistics to your skillset sets you apart in the job market.

  • 🔬 Hands-on practice — You’ll not only learn concepts but apply them through exercises, projects, and case studies using real-world datasets.

Who This Course is For

This course is perfect for:

  • 🎓 Business Students & MBA aspirants who want a strong foundation in analytics

  • 💼 Professionals in Marketing, Finance, HR, or Operations who want to analyze data effectively

  • 🧑‍💻 Aspiring Data Analysts and Data Scientists looking to build their technical toolkit

  • 📊 Researchers and Academicians who want to transition into applied statistical analysis

  • 🚀 Entrepreneurs and Startups aiming to use data to validate business strategies and scale smartly

What You Will Learn

By the end of this course, you’ll be able to:

  • Understand and apply core statistical principles in business contexts

  • Use R programming to process, clean, and analyze business data

  • Create meaningful visualizations and dashboards using ggplot2

  • Conduct hypothesis testing, regression modeling, and forecasting

  • Make strategic recommendations based on statistical analysis

  • Solve real business problems using end-to-end analytical workflows

Structured & industry vetted curriculum

Live Classes by Faculty

Practical Experience

Regular 1:1 Mentorship

Career Support

Aspirational Pair Group

Business Statistics by Using R Programming Course Curriculum

  • Importance of statistical thinking in business

  • Understanding types of data: qualitative vs quantitative

  • Measurement scales and levels of data

  • Role of statistics in business decision-making

  • Installing R and using RStudio interface

  • Data structures in R: vectors, lists, matrices, data frames

  • R basics: operators, functions, and packages

  • Importing and exporting data (CSV, Excel, web scraping)

  • Handling missing values

  • Data transformation and wrangling using dplyr

  • Data reshaping with tidyr

  • String manipulation and date-time formatting

  • Measures of central tendency and dispersion

  • Creating frequency tables and summary reports

  • Using ggplot2 for histograms, bar plots, box plots, scatter plots

  • Creating aesthetically appealing visualizations for business insights

  • Fundamental concepts of probability in business

  • Conditional probability and Bayes’ Theorem

  • Discrete distributions: Binomial, Poisson

  • Continuous distributions: Normal, Exponential

  • Sampling methods and sampling distribution

  • Estimation: confidence intervals for means and proportions

  • Hypothesis testing: one-sample and two-sample tests

  • Using t-tests, z-tests, chi-square tests in R

  • Scatterplots and correlation coefficients

  • Simple linear regression

  • Multiple regression and variable selection

  • Diagnostic measures and residual analysis

  • Predictive modeling in business scenarios

  • Understanding time series data in business (sales, revenue, etc.)

  • Trend analysis and seasonal decomposition

  • Moving averages and exponential smoothing

  • Forecasting models using forecast and ts packages

  • Retail analytics: customer segmentation and product demand

  • Financial analytics: portfolio returns and risk analysis

  • HR analytics: employee attrition and hiring patterns

  • Marketing analytics: campaign effectiveness and customer churn

  • Choose a real business problem

  • Define objectives and gather data

  • Analyze, model, and visualize findings using R

  • Present a full-fledged analytical report with actionable recommendations

Student Trained
0 +
Placements
0 %
Entreprenuers Helped
0 +
Hours Of Teaching
0 +
“Most companies have an IT organization, but they haven’t thought of the possibilities of decoupling the 'I' from the 'T' and managing information and technology as separate assets.”
Doug Laney, author, "Infonomics"
“Executive management is more likely to invest in data initiatives when they understand the 'why.'”
— Della Shea
“If you want people to make the right decisions with data, you have to get in their head in a way they understand.”
Miro Kazakoff

Embarking on the journey to become a Full Stack Web Developer is an exciting endeavor filled with endless possibilities.
A roadmap to success in this field typically involves mastering both front-end and back-end technologies. Begin by learning the fundamentals of HTML, CSS, and JavaScript for front-end development, followed by diving into frameworks like React, Angular, or Vue.js for dynamic user interfaces.
On the back-end side, familiarize yourself with server-side languages such as Node.js, Python, or Ruby, along with databases like MySQL, MongoDB, or PostgreSQL.
Additionally, understanding concepts like RESTful APIs, version control with Git, and deployment using platforms like AWS or Heroku is essential. Continuously building projects, solving coding challenges, and staying updated with industry trends will help solidify your skills and propel you towards becoming a proficient Full Stack Web Developer.
With dedication, perseverance, and a passion for coding, you’ll be well on your way to mastering the art of Full Stack Web Development


As a full-stack developer, ensuring job security involves mastering a comprehensive set of tools across both front-end and back-end development. Proficiency in front-end technologies such as HTML, CSS, and JavaScript is essential for creating visually appealing and responsive user interfaces.
Frameworks like React, Angular, or Vue.js further enhance development efficiency and user experience. On the back end, expertise in server-side languages like Node.js, Python, or Ruby, coupled with frameworks such as Express or Django, enables robust server logic and database management.
Version control systems like Git facilitate collaboration and code management, while Docker and Kubernetes streamline deployment and scaling processes. Additionally, understanding databases like MySQL, MongoDB, or PostgreSQL is crucial for data storage and retrieval.
By continuously honing skills in these tools and staying updated on industry trends, full-stack developers can secure their job roles in a competitive tech landscape and contribute effectively to diverse projects and teams.

Pinaki IT Consultant introduces an enriching Internship Program tailored for aspiring Full Stack Web Developers.
Led by industry experts, this program offers hands-on experience in front-end and back-end development technologies.
Participants will dive deep into modern web development frameworks, mastering essential tools and techniques to build dynamic and responsive web applications.
Through real-world projects and mentorship, interns will hone their skills in HTML, CSS, JavaScript, Node.js, React, and more. Join our Full Stack Web Developer Internship Program to gain valuable industry insights, expand your portfolio, and kickstart your career in the dynamic field of web development.